Hi Friends!
As teachers we have to collect lots of data on our students throughout the year. This data
drives our instruction. I work in a district that requires teachers to have a data center board
and data folders showing student growth. The data center board can be simple or elaborate.
Mine is somewhere in between. The data center board shows class goals and
averages, not individual scores. Today I'd like to share the folders that my students use
to store data about their own growth. At conference time, students share what's inside their
data folder with their parents. In my district we have student-led conferences. This basically means
that students come to the conference with their parents and they must share their work with
their parents. As a first grade teacher, I have my kids share parts of their data folders and
I discuss other parts. My kids do really well, but we practice a few times before the actual
conference so they know exactly what to do. Here are some pictures of my data folders.
 |
| I use a plastic 8 pocket organizer. I add a piece of decorative computer paper on the inside pocket for the cover. I put student's picture under the title. |

 |
| The first pocket holds a behavior graph. |
 |
| The second pocket holds the spelling graph. Kids graph their spelling test scores every week & then place the test behind the graph. |
 |
| The third pocket holds writing samples to be shared at conference time. |
 |
| The fourth pocket hold a leveled reading graph. I fill this out a and share it with parents so they can see where our district expects a first grader to be reading each quarter to "meet" expectations. |
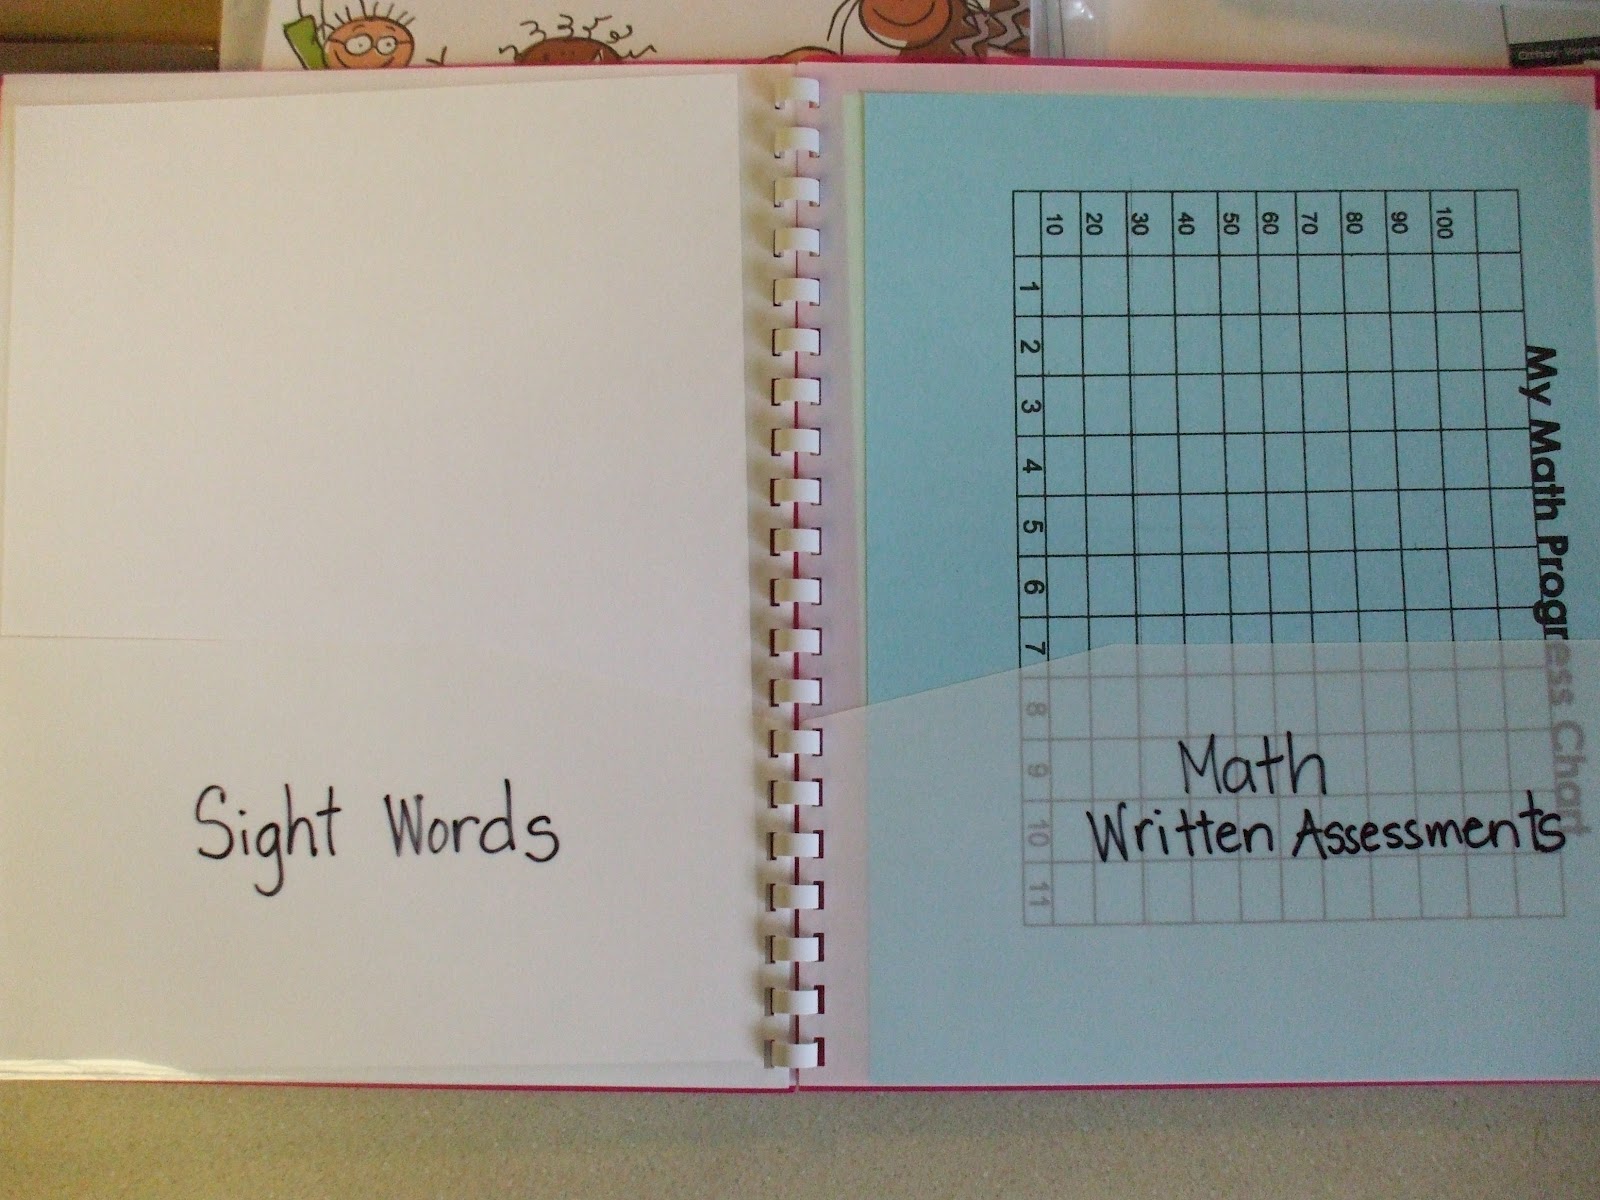 |
| Pocket 5 holds a list of district sight words that students are expected to know each quarter. Pocket 6 holds Math tests which are graphed by students. |
 |
| Pocket 7 holds Math Fact tests which are graphed by students. |
 |
| Pocket 8 holds a homework graph. Students have to color in a box if they don't return their homework. Students get a homework grade on their report card, so I use this for a grade. |
 |
| This is the the brand of folders I use. ***Click {Here} to see data sheets.***
Above is a link to the forms I put in my student
Data Folders. Some of them are generic
in form and can be used by anyone.
Others are specific to my district and would have to be modified. Here’s what’s included and a short
explanation of each.
Behavior graph: My
school has the same classroom rules for every classroom. You’ll see them listed below the graph. Purple should be on the list for “Complete
your homework” but I use a different graph for that, so I didn’t include it
here. I have a behavior “caterpillar” in
my classroom with these rules written on it.
If a student breaks a rule, he writes his name on the segment of the
caterpillar with that rule. At the end
of the day, I pull the student’s behavior graph and write the date above that
color on his graph. I keep all of my students’ graphs on a clip board for easy
access. At the end of the quarter, students
must color their graphs only where dates have been written above the color
word. The bar graph then shows what
specific behaviors are problematic. Some
teachers may have their students color in their graphs daily, weekly, monthly
or quarterly. There is a new graph for
each quarter. I copy this sheet for each
quarter on regular copy paper.
My Spelling Progress Chart:
In first grade in my district, there are 34 spelling tests for the whole
year. On this graph, students must
record the date next to the list (test) number and then color horizontally the
number of boxes to represent how many words they spelled correctly on that
particular test. This graph on has
enough room to graph 28 tests. I copy
the graph back to back on cardstock. I
got this form at a workshop many years ago.
I don’t know who created it.
My First Grade Writing Rubric: This is a form I use to evaluate a student’s
writing. I take 4 samples throughout
each quarter which is about every 2 weeks.
When the quarter is over, I use this sheet along with a current writing
sample to come up with a grade. This was
created by a teacher in my district named Becky Comp. The letters at the bottom of each rubric mean
(BE) Below Expectations, (ME) Meets Expectations, and (EE) Exceeds
Expectations. The numbers next to each quarter represent the number of points
need to “meet expectations” for each quarter.
This is still a work in progress.
I copy this on regular copy paper.
My Reading Progress Chart:
This represents Fountas & Pinnell guided reading levels for each
quarter for first grade. A students
“meets expectations” if she is reading at a level where the stars are for each
quarter. I copy this on cardstock.
District Sight Word Chart:
My district has sight words for each quarter. This is a sample of Quarter 1 sight word
list.
My Math Progress Chart:
This is used to record Written Assessments Scores in Math. I copy this back to back on cardstock.
My Math Facts Chart:
This is used to record Math FACT Tests.
I copy this back to back on cardstock.
Homework Chart: This
is very specific to my classroom. I have
to make a new one every year. When a
student doesn’t return her homework, she must color in the box for that
day. At the end of the quarter, I use
this information to give her a grade on her report card. I copy this back to back on cardstock.
I hope this has been helpful.
|